Analysis of a speech#
![]()
This pipeline is an educational example of how one could analyse a text using Asent. For this analysis we use a single speech from Trump.
import spacy
import asent

def load_speech():
    file_path = "trump_speech.txt"

    with open(file_path, "r") as f:
        speech = f.read()

    return speech

speech = load_speech()
print(speech[:200]) # examine the first 200 characters
Well, thank you very much. And good afternoon.

As President, my highest and most solemn duty is the defense of our nation and its citizens.

Last night, at my direction, the United States military su
To analyse the text we will need a spacy pipeline with the asent component and a sentencizer:
# create spacy pipeline:
nlp = spacy.blank("en")
nlp.add_pipe("sentencizer")
nlp.add_pipe("asent_en_v1")
doc = nlp(speech)  # process document
sentences = [sent for sent in doc.sents]  # extract sentences
Examining a sentence#
for i in range(5):
    asent.visualize(sentences[i])
---------------------------------------------------------------------------
ImportError                               Traceback (most recent call last)
Cell In[5], line 2
      1 for i in range(5):
----> 2     asent.visualize(sentences[i])

File ~/.local/lib/python3.12/site-packages/asent/visualize.py:310, in visualize(doc, style, cmap)
    307     style_ = "prediction-no-overlap"
    309 if style_ == "prediction":
--> 310     return visualize_prediction(doc, cmap=cmap)
    311 if style_ == "prediction-no-overlap":
    312     return visualize_prediction_no_overlap(doc, cmap=cmap)

File ~/.local/lib/python3.12/site-packages/asent/visualize.py:140, in visualize_prediction(document_obj, cmap)
    124 c_spans = [
    125     {
    126         "start_token": tp.span.start - span.start,
   (...)    130     for tp in t_pols
    131 ]
    132 ex = [
    133     {
    134         "text": span.text,
   (...)    137     },
    138 ]
--> 140 html = displacy.render(
    141     ex,
    142     style="span",
    143     manual=True,
    144     options={"colors": sentiment_color_dict},
    145 )
    147 return html

File ~/.local/lib/python3.12/site-packages/spacy/displacy/__init__.py:69, in render(docs, style, page, minify, jupyter, options, manual)
     65     html = RENDER_WRAPPER(html)
     66 if jupyter or (jupyter is None and is_in_jupyter()):
     67     # return HTML rendered by IPython display()
     68     # See #4840 for details on span wrapper to disable mathjax
---> 69     from IPython.core.display import HTML, display
     71     return display(HTML('<span class="tex2jax_ignore">{}</span>'.format(html)))
     72 return html

ImportError: cannot import name 'display' from 'IPython.core.display' (/home/runner/.local/lib/python3.12/site-packages/IPython/core/display.py)
If we want to take a closer look as a specific sentence we can use the analysis visualization.
asent.visualize(sentences[2], "analysis")
Already here we get quite a lot of information? Which opens up for a bunch of questions:
Should we update the model with new words?
Should we remove some words?
Could we do other things to improve the analysis? E.g. what about “United” in the United States? Should that be positive?
Extracting polarities#
To extract the polarity from a sentence we can simply use the ._.polarity attribute to get teh polarity of the sentence:
sentences[2]._.polarity
SpanPolarityOutput(neg=0.076, neu=0.853, pos=0.071, compound=-0.024, span=As President, my highest and most solemn duty is the defense of our nation and its citizens.

)
Then assuming we want the compound (average) polarity we can simply extract it as so:
# extracting polarity from one sentence:
compound_polarity = sentences[2]._.polarity.compound
compound_polarity
-0.024005576936002263
For all the documents we can thus do:
# Polarity pr. sentence
polarities = [sent._.polarity.compound for sent in sentences]
And we can then plot the polarities using matplotlib:
# Plot polarities
import matplotlib.pyplot as plt
plt.plot(polarities)
plt.title("Polarity of Trump's speech")
plt.xlabel("Chronological Order (sentence)")
plt.ylabel("Polarity")
Text(0, 0.5, 'Polarity')
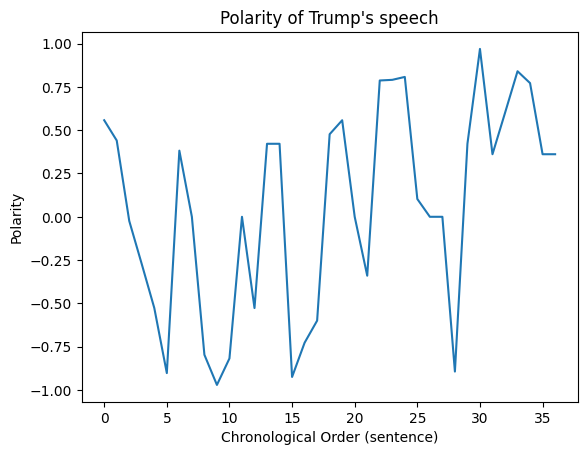
Analysis#
What do we see from this plot? We see that the Trumps speech consistently varies from positive to negative. For example:
“Under my leadership, America’s policy is unambiguous: To terrorists who harm or intend to harm any American, we will find you; we will eliminate you. We will always protect our diplomats, service members, all Americans, and our allies.”
Does this match with your subjective reading of the speech?
Other analyses we could take a look is:
extraction of positive/negative words
comparison of sentiment across documents
What is spoken positive or negative about? Can we use the Dependency tree?
Error analysis af lexicon
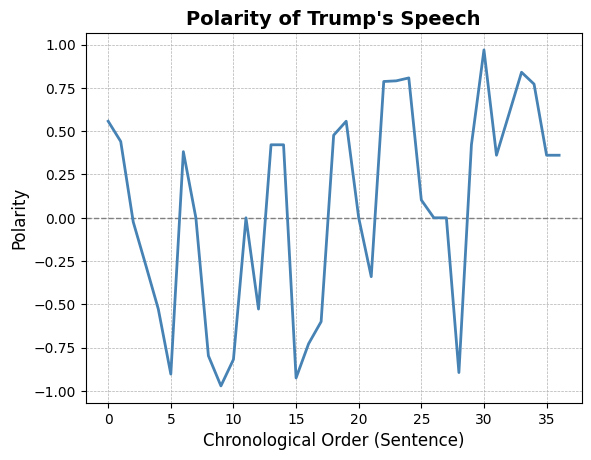
Improving the plot (optional)#
In the following I do a bit of work to improve the visualization.
# Add a horizontal line at y=0 to indicate neutrality
plt.axhline(y=0, color='gray', linestyle='--', linewidth=1)


# Plot polarities with a line style and color
plt.plot(polarities, color='steelblue', linestyle='-', linewidth=2)

# Improve the title and axis labels with font size adjustments and clarity
plt.title("Polarity of Trump's Speech", fontsize=14, fontweight='bold')
plt.xlabel("Chronological Order (Sentence)", fontsize=12)
plt.ylabel("Polarity", fontsize=12)

# Adding grid for better readability
plt.grid(True, which='both', linestyle='--', linewidth=0.5)

# Improve the tick marks for better readability
plt.xticks(fontsize=10)
plt.yticks(fontsize=10)


# Show the plot with the enhancements
plt.show()